
CHoCH vs Break of Structure: Market Structure Explained
- Business
- afaq anser35
- 2026-11-02 19:48:08
- 566556
Every price chart tells a story. However, most traders read only the last few candles and miss the bigger plot. Market structure is the framework that turns random-looking price movement into a readable sequence of highs and lows.
After two decades of watching charts across forex, stocks, and crypto, one lesson still holds true. Traders who understand market structure make fewer emotional decisions. They know where the trend is, where it may end, and where they are simply guessing.
Two concepts sit at the heart of this framework. The first is the break of structure (BOS). The second is the change of character (CHoCH). Both involve price moving beyond a previous swing point. Yet they mean very different things.
In this guide, you will learn what each term means, how to spot it, and how the two work together. Moreover, you will see the common mistakes that lead traders to confuse a healthy pullback with a true reversal.
What Is Market Structure?
Market structure describes how price moves between swing highs and swing lows over time. In simple terms, it shows who is in control: buyers or sellers.
Price never moves in a straight line. Instead, it travels in waves. Each wave leaves behind a peak or a trough, and these points form the skeleton of the trend.
There are four building blocks:
- Higher high (HH): a peak above the previous peak.
- Higher low (HL): a trough above the previous trough.
- Lower high (LH): a peak below the previous peak.
- Lower low (LL): a trough below the previous trough.
An uptrend prints higher highs and higher lows. In contrast, a downtrend prints lower highs and lower lows. When price moves sideways between a clear ceiling and floor, the market is in a range.
Market structure trading relies on reading these points in order. As a result, you stop reacting to every candle. Instead, you start asking a better question: is the current pattern continuing, or is it starting to fail? The break of structure and the change of character answer that question.
What Is a Break of Structure (BOS)?
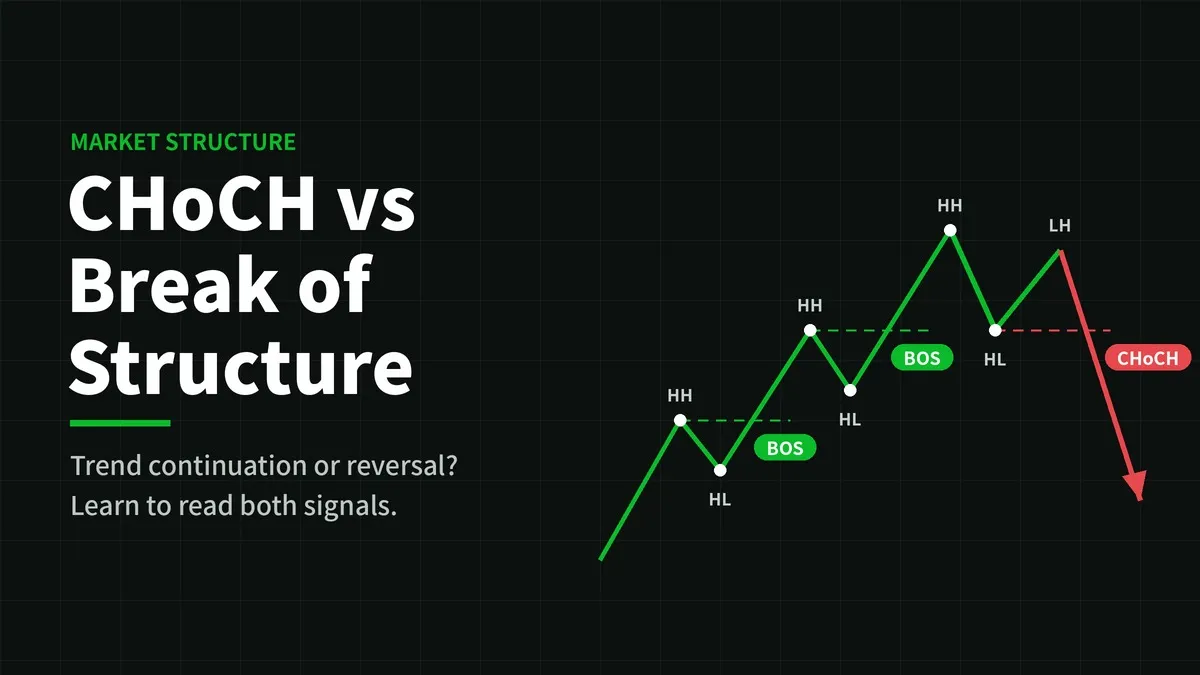
A break of structure happens when price moves beyond a previous swing point in the direction of the existing trend. Put simply, it confirms that the trend is still alive.
In an uptrend, a BOS occurs when price closes above the most recent higher high. In a downtrend, it occurs when price closes below the most recent lower low.
Think of it as the market renewing its contract. Buyers in an uptrend have pushed through the last peak, so they remain in charge. Consequently, trend followers gain the confidence to hold positions or look for the next entry.
Here is a simple bullish example. Price rises to 1.1050, pulls back to 1.1000, and then climbs to 1.1080. That move above 1.1050 is a bullish break of structure. Meanwhile, the 1.1000 low becomes the new higher low that buyers must protect.
A few habits help you read a BOS correctly:
- Look for a candle close, not just a wick. A wick beyond the level often signals a liquidity grab rather than real strength.
- Check the momentum. Strong, decisive candles carry more weight than slow, overlapping ones.
- Respect the timeframe. A BOS on the 5-minute chart may mean little against a daily downtrend.
In short, a break of structure tells you to stay with the trend. It does not tell you the trend is ending. That job belongs to a different signal in market structure.
What Is a Change of Character (CHoCH)?
A change of character is the first sign that a trend may be reversing. It occurs when price breaks a swing point against the direction of the current trend.
In an uptrend, a CHoCH forms when price closes below the most recent higher low. In a downtrend, it forms when price closes above the most recent lower high.
This matters because the higher low is the level buyers must defend. Once sellers push price below it, the bullish pattern breaks. In other words, the character of the market has shifted from strength to weakness.
Consider the earlier example again. Price made a higher low at 1.1000 and a higher high at 1.1080. Now suppose price drops and closes at 1.0980. That close below 1.1000 is a bearish change of character, because buyers failed to hold their key level.
However, a single CHoCH is a warning, not a verdict. Price can still recover and resume the uptrend. Therefore, experienced traders wait for confirmation. Typically, that confirmation arrives as a lower high followed by a bearish break of structure in the new direction.
Some traders call this concept a market structure shift (MSS). The labels vary between trading communities. Even so, the core idea stays the same.
CHoCH vs Break of Structure: The Key Differences
At first glance, both signals look alike. After all, each one involves price breaking a prior swing point. The real difference lies in direction and meaning.
1. Direction relative to the trend. A break of structure moves with the trend. A CHoCH, on the other hand, moves against it.
2. The level being broken. A BOS breaks the last swing extreme, such as the higher high in an uptrend. A CHoCH breaks the last protected swing, such as the higher low in an uptrend.
3. What it signals. A BOS points to continuation. A CHoCH points to a possible reversal or, at minimum, a pause in the trend.
4. How often it appears. In a healthy trend, you will see many BOS signals. By contrast, a CHoCH appears only once at the turning point, before a new sequence begins.
5. How traders respond. After a BOS, trend followers look for pullback entries. After a CHoCH, they tighten stops, take partial profits, or wait for the new trend to confirm.
Here is an easy way to remember it. BOS says "more of the same," while CHoCH says "something has changed." Once the new trend confirms, the next break in its direction becomes a fresh BOS. In this way, the two signals form a continuous cycle within market structure.
How to Use CHoCH and BOS Together
These signals work best as a sequence rather than in isolation. A practical market structure trading process often follows five steps.
- Mark the higher-timeframe trend. Start on the daily or 4-hour chart. Identify the latest swing highs and lows to define the main direction.
- Wait for a CHoCH on a lower timeframe. When price reaches a key higher-timeframe zone, drop to the 1-hour or 15-minute chart. Then watch for a change of character there.
- Look for the first BOS in the new direction. This step confirms that the shift has real strength behind it.
- Plan an entry on the pullback. Many traders wait for price to retrace into the zone that launched the move. This often gives a better price and a tighter stop.
- Place the stop beyond the protected swing. For a long trade, that usually means below the new higher low.
Let's put it all together. Suppose gold is in a daily downtrend but reaches strong weekly support. On the 1-hour chart, price closes above its last lower high. That is a bullish CHoCH.
Next, price pulls back, forms a higher low, and breaks the recent high. That is the first bullish break of structure. Now the trader has a structure-based reason to look for long entries. Equally important, they have a clear level that would prove the idea wrong.
Above all, alignment matters. A lower-timeframe CHoCH at a major higher-timeframe level carries far more weight than one in the middle of a range.
Common Mistakes and How to Avoid Them
Even experienced traders misread market structure from time to time. The following errors appear again and again.
- Treating every wick as a break. Wicks often sweep liquidity above highs or below lows. Instead, wait for a candle body to close beyond the level.
- Labelling minor swings. Not every small bounce counts as a valid swing point. Focus on swings that clearly pushed price away and caused a visible reaction.
- Ignoring the higher timeframe. A 5-minute CHoCH against a strong daily trend is usually just a pullback. So always check the bigger picture first.
- Entering on the CHoCH alone. A first CHoCH frequently fails. Waiting for a confirming break of structure filters out many false reversals.
- Trading in choppy ranges. When price moves sideways, highs and lows break constantly with little follow-through. As a result, structure signals lose much of their value.
Risk management ties everything together. No structure signal is right every time. For this reason, many professionals risk only a small, fixed share of their account on each trade, often 1% or less.
Also, define your invalidation level before you enter, not after. Finally, keep a trading journal with screenshots of every BOS and CHoCH you trade. Over time, this record will teach you more about market structure trading than any textbook.
Final Thoughts
Understanding market structure is one of the most valuable skills a trader can build. A break of structure confirms that the current trend remains in control. A change of character, meanwhile, warns that control may be shifting. When you read both signals in sequence and across timeframes, your charts become far easier to interpret.
Practice marking swings on historical charts before you risk real money. Let the structure, not emotion, guide your decisions. Some traders also use indicators such as GainzAlgo to help highlight trend shifts on their charts. If you are asking "is GainzAlgo legit," the most reliable answer comes from testing any tool against these structure principles on a demo account and judging the results yourself.
655 people like this















About Premium Author
This post has been authored and published by one of our premium contributors, who are experts in their fields. They bring high-quality, well-researched content that adds significant value to our platform.